
The Lost Art of the Mid-Range
Published:
The rise of analytics in the NBA has led to the realization that mid-range shots (those that come from outside of the key but inside of the three-point line) are a relatively inefficient way to score points. This has resulted in a league-wide abandonment of the mid-range jumper in favor of a tremendous increase in three-point shots. Now, I am all for using statistics to be better at sports, but those of us that watched legends like Michael Jordan or Dirk Nowitzki in their heyday can’t help but feel a pang of sadness. Rationality be damned, seeing Kobe Bryant shoot an off-balance long two over a defender’s outstretched hands was pure magic. Moments like that are the reason people watch basketball in the first place.
Unfortunately, although I am a basketball romantic, mathematics is definitely not. Take a look at the clip below.
Dennis Smith Jr. considers taking a wide-open three, and then steps forward to instead take a long two. This was a bad decision. The two point shot is only slightly easier than the three that he passed up, but the latter also had a 50% higher point reward! That’s like only reading the left pages of a book. Or like deliberately picking an ugly outfit for a first date. Why make life harder for yourself? Look, I know the Knicks are an easy target, but this example just illustrated my point too perfectly for me to not use it.
Teams are encouraging their players to shoot more and more from outside the three-point line. So we can expect the mid-range to continue floundering into obscurity. This reality, after all, is dictated by the rules of the game. But…what if, just for fun, we changed the rules?
The New Math of the Bizarro NBA
Legend has it that Antoine Walker was once asked why he shot so many threes. His response: “Because there are no fours”. Walker himself was not a great shooter, but he raises an interesting point: what if shots were worth something besides two or three points? After all, it seems fair that a 28-foot shot should be worth more than a 24-foot shot which should be worth more than a 15-foot shot.
Imagine an alternate Bizarro universe, where Bizarro NBA Commissioner Adam Silver proclaims that shot values will be adjusted in the 2019-20 Bizarro NBA season. One can imagine more lines added to the court to indicate a four-point distance, a 2.5-point distance, etc. But that would be confusing and is in fact not at all necessary. Modern video technology can track all ten players on the court for every minute of every game, so it’s easy to figure out where on the floor each shot originated from. This allows us to ask the question: what if the value of every NBA shot was determined by the exact distance of the shot from the hoop?
Let’s say that a shot taken right underneath the hoop is worth the old familiar 2 points, and that a shot taken exactly at the three-point line at the top of the key is worth 3 points. For a given shot distance \( x \), the point value of the shot is given by \( N(x) = 2 + cx \) where \( c \) is a constant defined so that a 23.75 foot shoot is worth exactly 3 points (i.e. \( N(23.75) = 3 \) ).
We can visualize what this new points system looks like by considering DeMar DeRozan, one of the few mid-range specialists surviving in the modern NBA. Below are two shot charts that show the starting locations of every single shot that DeRozan made during the 2018-19 NBA season, with the point values of each shot indicated by the color of the corresponding dot. The left chart shows the point values for the real NBA scoring system, and the right chart shows the point values when using our new Bizarro system.
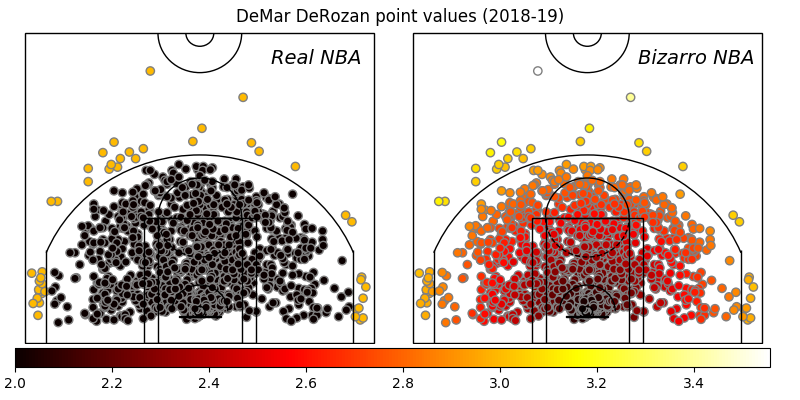
On the left, all of those black dots are worth exactly two points and the yellow dots are worth exactly three. On the right, there is a continuous range of colors since each dot has an individual value depending on how far away the dot is from the basket. What were previously DeRozan’s long two’s are now two-point-eight’s. His style all of a sudden goes from being an outdated throwback to a potentially valuable strategy.
BNBA All-Stars
We can make a list of every single shot taken during the 2018-19 NBA season, and calculate how many points each shot would be worth in the Bizarro NBA by using the distance from the shooter to the hoop. We can add up all the shots each player took to get a new Bizarro point total. (In this case, I am ignoring all points from free throws: the only points that matter are those that come from a made basket during the normal flow of the game.) Here is a comparison of the real NBA point totals vs. the new ones.
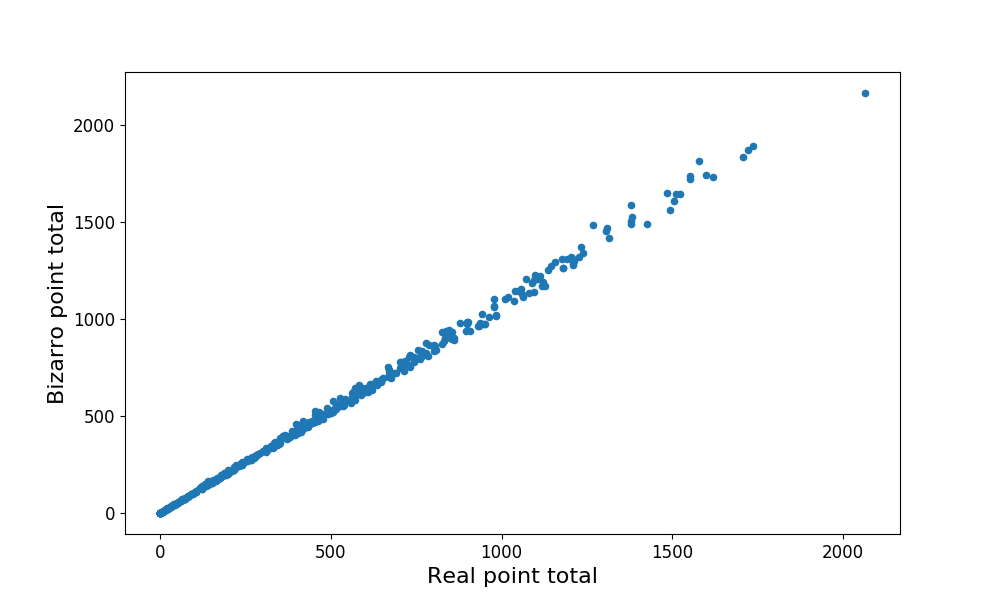
So the general trend is that the more real points a player scored then the more Bizarro points they would have scored. Makes sense. There is not a whole lot of spread in the point distribution, which means that the new point system probably does not make a huge impact on overall point scoring. Let’s look at this a few other ways.
We can rank all the NBA players in the 2018-19 season, both by the real number of points they scored as well as by the hypothetical Bizarro points. So each player has two rankings: a real one and a Bizarro one. Here is a plot that compares the these two rankings for the top 100 scorers.
![]()
That red line indicates players who have the same exact ranking in both cases. Dots below the line have a better (lower) ranking in the new system, and dots above the line have a worse (higher) ranking in the new system. You can see a little bit more clearly the impact that the rule change has. Some players move up or down by 5-10 places in the ranking order…but nobody really moves into a new echelon of scoring prowess, for better or for worse.
I want to see specifically which current NBA players would benefit (or suffer) the most from this bizarro point system. One question to ask: how does a player’s scoring output compared to the league average in the real NBA change with the Bizarro NBA point system? Consider a player’s performance boost, which I define as the change in a player’s scoring output compared to the league average scoring output. So, if Player X scores 10% more points than the average player in the real NBA, but 15% more than the average player in the Bizarro NBA, then his performance boost would be 15 - 10 = 5%. Furthermore, you would expect the players who take a higher fraction of their shots in the mid-range (like Demar DeRozan) would get bigger performance boosts. And that is in fact the case: the following plot shows the performance boost vs. the percentage of a player’s shots that come from the area farther than 10 ft away from the hoop and closer than the three point line.
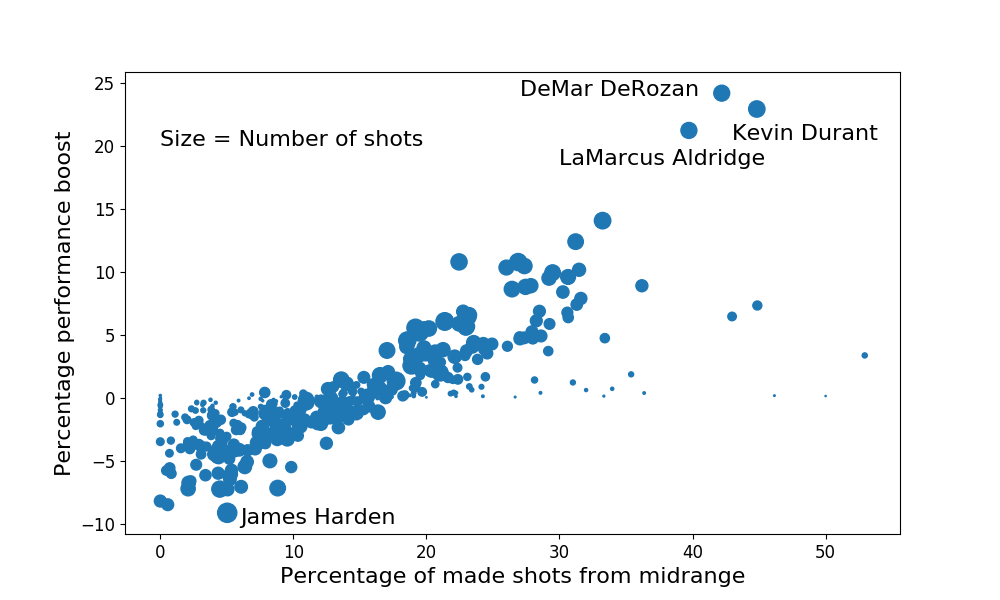
Each dot corresponds to one player, and the size relates to the number of shots taken by that player. As expected, the more mid-range shots a player takes, the more likely this new point system benefits him. There are clearly three players who gain the most from this system. Demar DeRozan and Lamarcus Aldridge are both known for taking a lot of jump shots, so it’s not surprising to see them excel in the Bizarro NBA. But I was surprised by the third name: Kevin Durant. He’s already so dominant offensively…and with the Bizarro rules he would score even more.
James Harden’s dot (which is the biggest because he takes the most shots out of any player in the NBA) is in the lower left corner, meaning that he gets slightly worse compared to the average player. Harden prioritizes taking shots either very close to the hoop or at the three-point line, so this makes sense. Both of these shots are not increased much in the Bizarro NBA. However James Harden is still clearly the highest scorer even taking into account a slightly worse performance relative to the average.
In the end, the Bizarro NBA might not look all that different from what we have here in the real universe. Its unclear to me whether this change would make basketball more exciting. On the one hand, imagine a team hitting a six-point full-court buzzer-beater to win the game! One the other hand, ties (and therefore overtime) are far less likely. And of course this entire premise is impractical and makes the game harder to follow. One thing is clear though: we should enjoy Kevin Durant while we can, since he is the closest thing we have to a modern-day Black Mamba. In this case, calling him a snake is a compliment.
Technical Details
Code used for gathering data, analysis, and plot generation can be found here. The data for this project was collected using the stats.nba.com API, and the analysis was done using standard Python packages.
Some caveats. First, this post completely neglects free throws, which make up about 15% of all points scored in the NBA. Second, a change in the rules would influence player and team strategy. I have no doubt that James Harden could dominate in the mid-range, if he wanted to. Third, the bizarro point system is not normalized to the old point system, so the value of each point is dilluted slightly.
I am surely just scratching the surface of this Bizarro universe. There are lots of other ways to change the point values. Like, maybe a 10-foot shot is worth only slightly more than a 2-foot show, but a 38-foot shot should be worth a lot more than a 30-foot shot. There are plenty more questions to ask, too. How are efficiency statistics affected? Which specific shots are now the most efficient? Which defenders get more or less valuable? Any other ideas? Or is there another NBA rule change that would be fun to think about?
I thought a lot about whether I should normalize the bizarro points system to the real one. E.g., I could make \( c \) equal to whatever value allowed the total number of real points scored from field goals to be equal to the total number of bizarro points scored from field goals. This would have allowed for the PPG stats to be compared on the same exact scale between the two points systems, and also keeps the relative importance of free throws constant (for calculating efficiency metrics). In the end I decided against this for two reasons. First, there are two parameters to vary in the equation for \( N(x) \), and it was not clear the best way to constrain one or the other. Second, I wanted to preserve the intuitive nature of the boundary conditions described above.
For drawing the court lines in the shot chart, I used an approach written by Savvas Tjortjoglou.